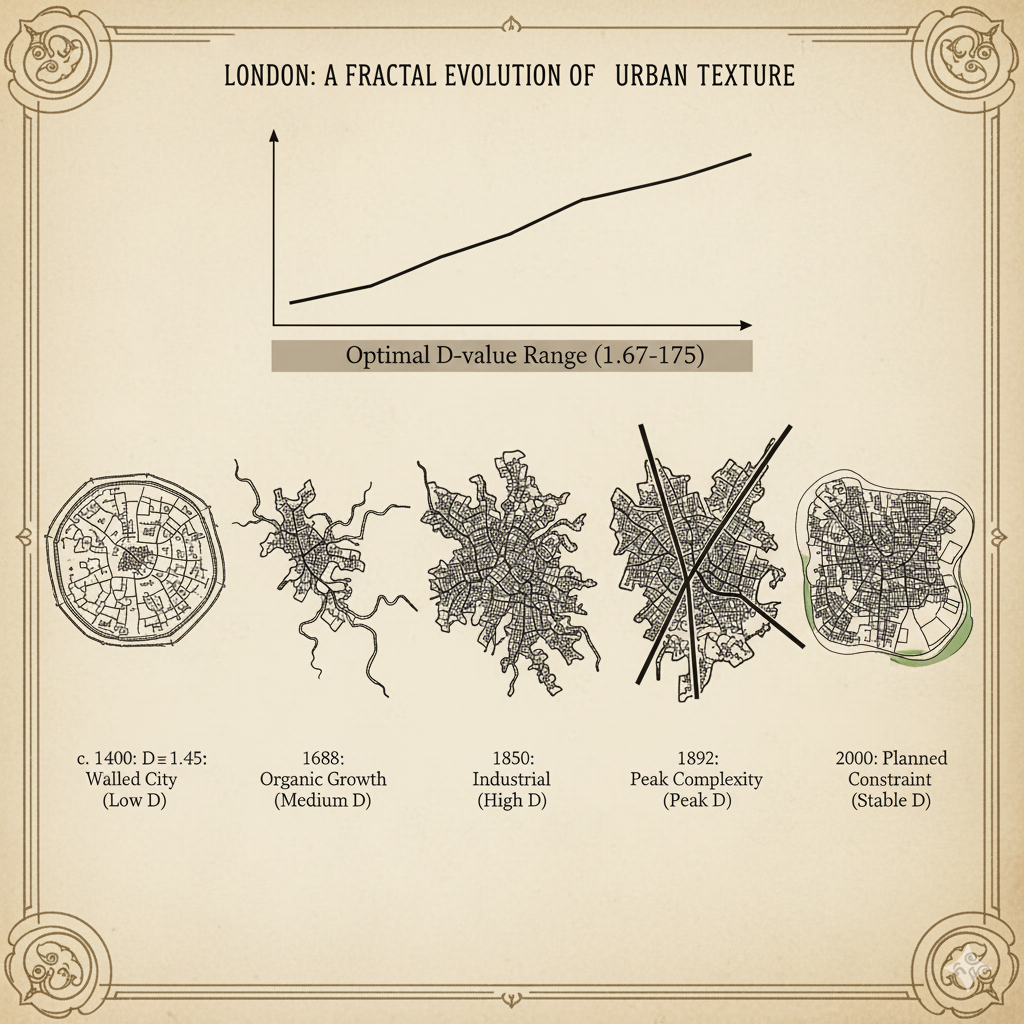
Introduction:
While urban form may seem chaotic, Fractal Geometry reveals that this “messiness” conceals a deep mathematical order. Michael Batty’s classic work, Fractal Cities, introduced the Fractal Dimension (D) as a tool to quantify a city’s complexity, density, and growth patterns. For planners and geographers, mastering the calculation of the D-value is the key to interpreting the urban fabric.
1. The Core Concept: The Essence of Fractal Dimension (D)
The Fractal Dimension (D) is a metric that measures an object’s complexity and its efficiency in filling space.
- Euclidean Limitations: Traditional Euclidean geometry can only describe regular objects using integer dimensions (1, 2, 3). The twisted, irregular forms of urban coastlines or transportation networks cannot be precisely described by integers.
- The Range of D: Since urban form is an object embedded in a two-dimensional plane (DT=2 ), its Fractal Dimension (D) typically falls between 1 and 2.
- D \rightarrow 1: The form is sparse, simple, and linear.
- D \rightarrow 2: The form is complex, dense, and uniformly fills the plane.
2. Quantification Tool I: The Box-Counting Method
The Box-Counting Method is the most common and direct way to calculate the Fractal Dimension (Db). It quantifies the geometric complexity and space-filling uniformity of a city’s built-up area.
Core Formula:
The fractal dimension Db is derived from the power-law relationship between the number of boxes N(s) and the box size s:
log(N(s)) ∝ Db log(s)
Or calculated as:
Db=log(N(s))/log(1/s)
Planning Significance:
- A higherDb value means the urban form is more complex and dispersed (e.g., Baltimore in 1992 had D =1.72), indicating a high degree of urban sprawl.
- A Db value stabilized within an ideal range (e.g., around 1.67–1.75) may represent an intensive and efficient urban form [context: Analysis of results from the simulation task].
3. Quantification Tool II: The Mass-Radius Method
The Mass-Radius Method is used to quantify the aggregation of mass (e.g., population or activity) around a central point. It explains how urban density decays with distance.
Core Formula:
The cumulative mass N(r) and the radius r follow a power-law relationship:
N(r) ∝rD
Planning Significance:
- A higher D value means that population or built-up density decays slowly with distance, resulting in a more uniform and compact urban structure.
- A lower D value (closer to 1) means that mass is highly concentrated at the center, with a sharp drop in density towards the periphery [context: Analysis of results from the simulation task].
4. The Driving Mechanism: Fractal Growth Model (DLA)
Fractal cities not only describe form but also explain how the form is created.
- Model Name: Diffusion-Limited Aggregation (DLA) model.
- Core Principle: The complex macroscopic urban form emerges bottom-up from countless random and irreversible local decisions (new particles randomly walk, and stick upon contact with the cluster).
- Urban Analogy: An individual chooses to settle near existing infrastructure (the local sticking). This repeated local preference forms the city’s characteristic dendritic, fractal structure.
Conclusion:
The Fractal Dimension is a bridge connecting urban form, complexity, and growth mechanisms. By mastering the Box-Counting and Mass-Radius Methods, you can replace intuition with quantitative analysis and truly understand the “ordered chaos” of the urban megasystem.
Leave a Reply